
Storm Stats: Expected Goals, Finishing, and Leveling-up
By Katie Bartlett
If you examine many 5v5 offensive stats, you will see the Carolina Hurricanes at the top of many categories. As of January 19th, they are first in Corsi, Fenwick, Shots, Scoring Chances, and Expected Goals. However, when it comes to actual goal production, they are only thirteenth in the NHL. So why are the Canes so statistically dominant in the offensive zone and yet struggle to convert those opportunities into actual literal goals? Let’s dig into the data and look at what it tells us.
That is an expected goal (xG)?
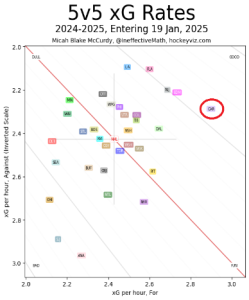
Simply put, statisticians calculate the likelihood that an unblocked shot will result in an actual goal being scored. Factors that get considered in such calculations include shot type, angle of the shot, shot speed, distance to the goal, shot location, and many, many more. If a shot according to the algorithm has an eight percent chance of becoming a goal, it is given an xG value of .08. The more dangerous the scoring chance, the higher the xG value. As seen on the graph to the right, Carolina is good at creating expected goals on offense and limiting expected goals on defense.
Finishing (not so) Strong
While it is great that the Carolina Hurricanes are elite at creating scoring chances, and thus a high xG stat, they struggle to convert those opportunities into actual goals. As shown on the second graph (focus on the bottom axis), for every one hundred expected goals that they generate, they only score about ninety goals. Only six teams convert at a lower rate than the Canes. The team’s saving grace is that they produced so many shots on goal and scoring chances that they are able to score enough to stay competitive in many games. As of 1/19, the Hurricanes have created 110.12 xG but have only scored 97 goals. The Washington Capitals, who are ten points ahead in the Metro, have scored 107 goals on 100.3 xG. With just a little more finishing, the Canes would be challenging for first in the division instead of battling for second with New Jersey.
Time to Level Up
When looking at the individual 5v5 stats for the Canes’ forwards, only four (Roslovic, Robinson, Necas, Blake) have more goals scored than individual expected goals (ixG) created on the season. The three forwards who have the worst xG to goals differential are Svechnikov (-6.68), Aho (-3.26), and Carrier (-3.02). It is clear from the stats that Svechnikov and Aho’s lack of 5v5 production has been a detriment to the team this year. The coaches and the team need to find ways to get those two to finish the chances that they create in the offensive zone. That starts by emphasizing taking more shots when they get good looks rather than deferring to teammates and/or looking for low-percentage passing opportunities. Both Svechnikov and Aho have good shots that need to be front and center of the Canes offense.
Note: All stats are obtained from free content available from Natural Stat Trick, HockeyViz, MoneyPuck, and JFresh via their sites and/or content posted on Twitter/X.

No comment